Trend analysis involves studying prices and patterns over a specific period to identify the directional movement. Trend analysis provides valuable insights into the past and helps for better planning of future price movement. The candlestick chart represents the price of an instrument of any financial market, the direction of the price movement is not always easy to find or understand which side we have to make a position.
One valuable tool in analyzing market movements is the trend line, which provides insights into the direction and momentum of various financial instruments. In this blog, we will delve into the world of trend analysis in the financial market, exploring their significance and how they can be effectively utilized because we always heard that “trend is your best friend – trade with the trend”.
What is Trend Analysis?
The trend is the main tool of trend analysis, a trend refers to the general direction in which the market or an asset’s price is moving over a specific period of time. By identifying trends, and doing trend analysis traders can make better predictions about future price movements and adjust their trading strategies accordingly.
Classification of the trend for trend analysis:
There are three primary types of trends commonly observed in the stock market. A stock price moves only 20% time in a trend and 80% of the time remains sideways. Therefore if we do mastery in sideways trend analysis then 80% time we will remain in a tradable position.
- The price of an instrument (Stock, future, option) is making new highs over some time period then the trend of that instrument is called Uptrend.

2. Price of an instrument (Stock, future, option) is making new lows over some time period then the trend of that instrument is called Downtrend.

3. Price of an instrument (Stock, future, option) is not making either new highs or new lows over some time period then the trend of that instrument is called Rangebound/Sideways.

Identifying Trend
There is various method to identify a trend clearly such as
- Trendline
- Technical indicator (RSI, MACD, Bollinger Band).
- Moving average
I will discuss only about the trend line here. As mentioned earlier the trend is time perspective, it always matters of time interval. If a stock is in an uptrend in the monthly chart, it can be in a downtrend in the weekly/daily time frame, even it may also be in an uptrend also. A trend is always easier to see after it is established and once established more likely to continue than reverse.
Trend line:
This is an angled line sloping either upward or downward through two to three significant price points in the chart.
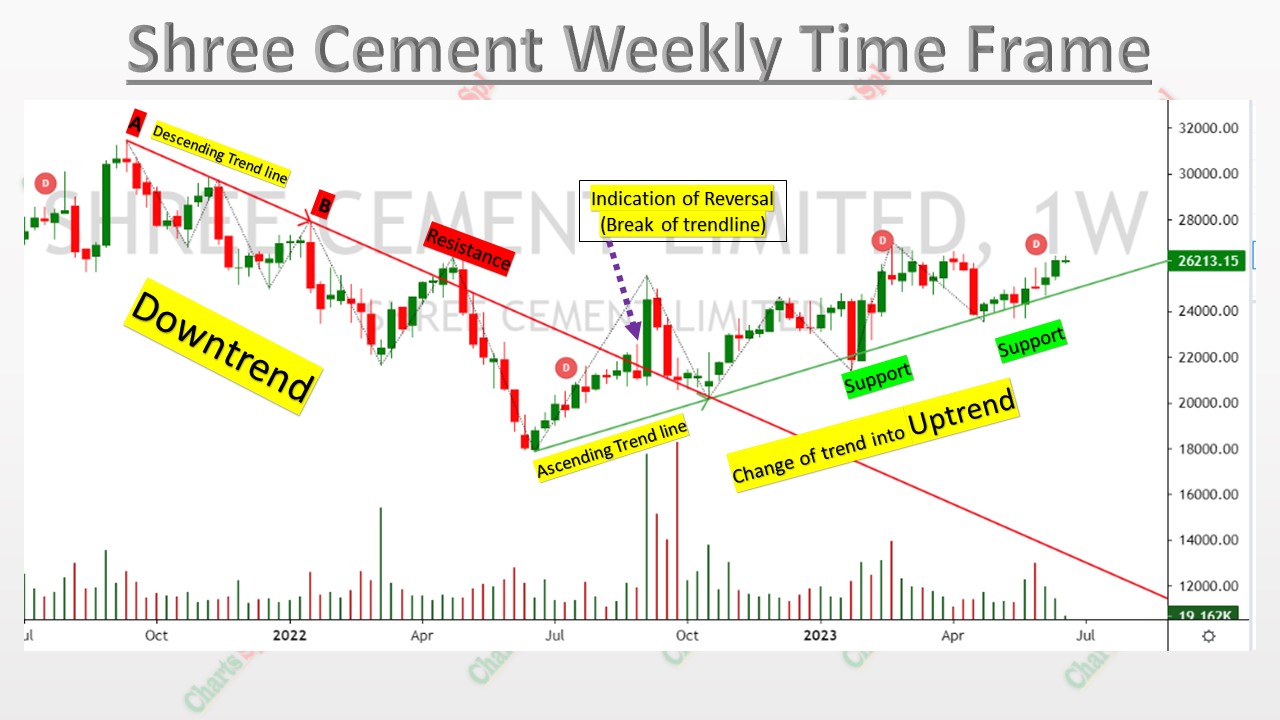
An upward (ascending) trend line is drawn by connecting consecutive significant lows over some time period and if the price moves higher by maintaining this line then the price is continuing uptrend. This line acts as dynamic support to the price. It indicates a potential buying opportunity to the trader when the price further reaches at this trend line. If the price breaks below the uptrend line, it may signal a potential trend reversal.
A Downward (Descending) trend line is drawn by connecting significant highs over some time period and if the price moves lower by maintaining this line then the price is continuing downtrend. It indicates a potential Selling opportunity to the trader when the price further reaches at this trend line. If the price breaks above the descending line, it may signal a potential trend reversal.

Method of Drawing Trend line:
For ascending trendline find two recent low of that time frame (Swing low), draw a line by connecting these two lows and extend it. Whenever the price remains above this line, consider the price is strong, line will provide support and is in uptrend.

For descending trendline find two recent high of that time frame (Swing high), draw a line by connecting these two highs and extend it. Whenever the price remains below this line, consider the price is weak, the line will provide resistance and is in a downtrend.

Trend Reversal
When a trend line is broken with volume then that is the first indication of trend reversal.
An upward line breaks out then may a downtrend starts. Similarly, if the downward trend line breaks out then may an uptrend start.

Points to remember:
- We all know everything looks smoother when we look at it from a distance. It is also applicable to trend lines also.
a) The trend line in the Daily chart is smoother than 15 Min or 5 min time frame chart.
b) The trend line in the Weekly chart is Smoother than the Daily chart.
c) The trend line in the Monthly chart is smoother than in the Weekly chart.
2. The trend may change if the time frame change. (i.e uptrend in the monthly time frame but downtrend in the daily time frame).
Importance of trend line:
a) Helps to identify the current trend or price direction.
b) Provides dynamic support (in an uptrend) or resistance (in a downtrend).
c) Provides opportunities to enter into trade.
d) Manages the risk by providing potential signals of price reversals or continuation of the trend.
e) Provides stop loss and profit-taking points
Conclusion:
Understanding trends and effectively utilizing trend lines are crucial skills for market participants/traders in the financial market. By recognizing and trend analysis, traders can make firm decisions, manage risks, and identify potential opportunities for profit. Trend lines serve as valuable tools in this process, providing visual support and resistance levels that aid in determining market direction and momentum. Incorporating trend line analysis into one’s trading strategy can enhance decision-making and increase the likelihood of successful outcomes in the dynamic world of finance.
To learn about my trading system, read systematic trading.

